Your investments. One powerful view.
Your portfolio’s value, performance and allocation, together in one overview.
- Follow performance over time.
- Understand how your investments are spread.
- Compare your portfolio with a benchmark.

Your portfolio, understood
See what you own. Understand what matters.
Bring your accounts into one view, examine the risks behind your holdings, and review account-specific tax-loss opportunities before deciding what to do next.
No credit card required. Supported connections and imports are available within plan limits. Advanced risk analysis and tax-loss harvesting require eligible Pro or trial access. Brokerage and data coverage vary.
Separate accounts. One portfolio view.
Understand your combined portfolio without losing the account and position detail needed to investigate a holding.
See where each position is held
Switch between By Account and By Symbol in the app to investigate holdings, shares, cost basis and transactions. Supported brokerage connections and CSV/Excel imports bring records together; not every brokerage is supported, and refresh timing varies.
Review the combined holding
Review positions across accounts without treating separate brokerage accounts as separate portfolios. These are captured app controls, not live brokerage connections or trading controls.
Free includes one portfolio, 12 active non-cash holdings and scheduled sync. Pro includes uncapped portfolios and holdings, plus on-demand sync where supported. Multiple accounts alone are not Pro-only.
Understand the risks a balance alone cannot show.
Examine how your portfolio behaves, where exposure is concentrated, and how a hypothetical market decline could affect your holdings.
Risk and risk-adjusted performance
Review the portfolio risk scorecard, beta, Sharpe, Sortino, volatility, trailing drawdown and modeled Value at Risk. Check the displayed historical windows, units, confidence levels and data coverage. These are computed analytics—not generative AI output.
Historical/model-based estimates. Results depend on available data and assumptions. Hypothetical market-decline scenarios are not a forecast, guaranteed maximum loss, or a promise of protection. Not personalized investment advice.
What might a broad market decline mean for my portfolio?
Inspect hypothetical market-decline assumptions and the displayed holding impacts. A modeled scenario helps frame a question; it does not predict the next decline or cap your losses.
Historical/model-based estimates. Results depend on available data and assumptions. Hypothetical market-decline scenarios are not a forecast, guaranteed maximum loss, or a promise of protection. Not personalized investment advice.
Where is my portfolio concentrated, including inside its funds?
Examine sector risk and defensive allocation, then look inside supported funds. Fund composition may be incomplete or unavailable; this is not complete real-time look-through or detection of every duplicated exposure.
Historical/model-based estimates. Results depend on available data and assumptions. Hypothetical market-decline scenarios are not a forecast, guaranteed maximum loss, or a promise of protection. Not personalized investment advice.
How to read risk and fund coverage
Historical and modeled metrics depend on the available time window, benchmark and underlying data. Check the source screen for its units, confidence levels and notices. Fund holdings can be incomplete, unavailable or dated; unknown exposure is not zero exposure.
For optional AI-assisted explanations, explore Hootie. AI can be inaccurate and is separate from these computed portfolio analytics.
Find loss lots worth reviewing before year-end.
Review eligible taxable-account purchase lots with unrealized losses, their short- or long-term holding periods, and illustrative tax-benefit estimates.
Account-specific opportunities, with context
Review the Tax Harvest summary alongside its account and data coverage. Illustrative estimates use fixed 37% short-term and 20% long-term rates, not your personal tax bracket. Stored reference prices may be stale.
U.S. taxable-account estimates using illustrative rates, stored reference prices and account-scoped FIFO lots—not broker-certified tax basis, a tax return, or guaranteed savings. Wash-sale checks are incomplete: future, spouse and substantially identical security purchases may not be known. Verify with your broker or tax professional before trading.
One ticker can have different holding periods
Inspect each account’s remaining shares, acquisition date, cost basis, reference value and holding-period badge. The first long-term date is the day after the calendar-year anniversary—not a blanket 365-day rule or the symbol’s oldest purchase. Tax Harvest neither places a trade nor enrolls you in a holding alert.
U.S. taxable-account estimates using illustrative rates, stored reference prices and account-scoped FIFO lots—not broker-certified tax basis, a tax return, or guaranteed savings. Wash-sale checks are incomplete: future, spouse and substantially identical security purchases may not be known. Verify with your broker or tax professional before trading.
What needs verification before I act?
Known retirement accounts are excluded from loss opportunities. Unknown account types and incomplete basis/date information stay explicit. Recent recorded buys and reinvestments are checked across accounts, including retirement accounts. No warning is not wash-sale clearance; missing data is not a clean bill of health.
U.S. taxable-account estimates using illustrative rates, stored reference prices and account-scoped FIFO lots—not broker-certified tax basis, a tax return, or guaranteed savings. Wash-sale checks are incomplete: future, spouse and substantially identical security purchases may not be known. Verify with your broker or tax professional before trading.
What the tax estimate does not calculate
FIFO is an analytical estimate; a broker may use specific identification or another valid method. Fees, return of capital, inherited, gifted or transferred shares, prior wash-sale adjustments and tacked holding periods can affect basis or eligibility.
This is not full capital-gain/loss netting, carryforwards, deduction caps, filing status, state taxes or surtaxes. The model does not calculate replacement-share matching, adjusted basis or permanent IRA disallowance amounts. Disconnected accounts, options and substantially identical different tickers are not comprehensively checked.
Tax Harvest is separate from long-term holding reminders. It does not execute brokerage trades or recommend selling around an anniversary.
Income, with the details behind it
See what your portfolio pays— and what supports it.
Bring dividend income, payment timing, quality signals and growth scenarios into one connected view of the investments you own.
90-day Pro trial. No credit card required. Core income views are available on Free. Advanced dividend quality and Horizon may require eligible Pro or trial access. Plan limits, availability and data coverage vary.
Actual SavvyStocks development-app captures from a fictional demo account. Captured values are examples, not current quotes or recommendations. Estimates are not guaranteed payments. The showcase does not auto-update; screens may reflect different cache times.
Income picture
Your portfolio’s income, in one clear view.
Review estimated annual dividend income, portfolio yield and yield on cost, alongside the mix of holdings contributing to that income.
Annual income is a forward estimate based on current rates—not cash already received or a guaranteed payout. Yield uses current value; yield on cost uses cost basis. Not every security pays dividends.
Methodology & coverage
The overview and dividend-health snapshot describe the captured demo portfolio, not your accounts. Screens can reflect different cache and capture times; values are not edited to force agreement.
Payment pattern
See how income is distributed through the year.
Explore monthly dividend history and the payment calendar, with received payments distinguished from confirmed and estimated future dates.
Received payments, confirmed dates and estimated future dates are different statuses. Estimated payments can change. Projection accuracy is historical feedback, not a reliability guarantee.
More captured detail & methodology
Use the ticker legend to see each investment’s contribution to the monthly bars. Expand the actual payment list and calendar to inspect the app’s original status and confirmation labels.
Dividend quality
Examine the quality behind the dividend.
Review dividend-quality scores alongside growth, payment consistency and supporting metrics, so a yield figure is the start of the research—not the end.
Quality scores are derived research aids, not credit ratings or a promise against dividend cuts. Missing history and limited methodology constrain the result. No complete BDC underwriting, guaranteed safety or future dividend growth is implied.
More captured detail & methodology
Payment streaks describe available history, not a promise of future payments. Keep missing-history and methodology labels in view. Advanced dividend-quality tools may require eligible Pro or trial access.
Income concentration
See where your dividend income is concentrated.
Identify the investments contributing most to income and examine whether a few positions account for a disproportionate share.
This is an income-contribution view—not proof of complete portfolio risk or fund-level look-through diversification.
Methodology & coverage
Income concentration and portfolio-value concentration answer different questions. A large share of dividend income does not describe every underlying economic exposure.
Longer-term scenarios
Explore income growth with the assumptions in view.
Use Horizon scenarios to explore how contributions, growth assumptions and dividend reinvestment could change the longer-term income picture.
Horizon is an assumption-based scenario, not an AI forecast, guaranteed return, retirement sufficiency assessment or promised income. Inspect the displayed inputs and assumption note. Eligible Pro or trial access may be required.
Methodology & coverage
Contributions, growth and reinvestment assumptions change a modeled outcome. Actual prices, payments, taxes, fees and investment decisions can differ. No future income is guaranteed.
Research, connected to what you own
Go beyond the quote. Put the investment in context.
Explore stocks and funds, compare alternatives, discover ideas, and connect your research to your own portfolio in one workspace.
90-day Pro trial. No credit card required. Free includes core lookup and limited comparisons. Pro expands comparisons and advanced research. AI requires eligible Pro/trial access, consent and available usage budget. AI can be inaccurate; verify important information. Plan limits, availability and data coverage vary.
Actual SavvyStocks development-app captures from a fictional demo account. Captured values are examples, not current quotes or recommendations. App areas: Insights / Discover / Analyze. The showcase does not auto-update; screens may reflect different cache times.
Portfolio context
Start with the questions that matter to your holdings.
Bring portfolio-aware context and benchmark comparisons into the same workspace as your investment research. Use AI-assisted explanations where enabled to investigate further—not to replace the underlying evidence.
Metrics and calculations are not AI predictions. Compare matching windows, units, benchmark selection and calculation methods; dollar changes are not percentage returns. No outperformance is guaranteed. AI explanations can be inaccurate; they are not investment or personalized tax advice, comprehensive real-time news or automatic trade recommendations.
More captured detail & methodology
AI interpretation may be inaccurate. It is not investment advice, comprehensive real-time news, personalized tax advice or an automatic trade recommendation. Verify important facts, sources and dates. AI requires eligible Pro/trial access, consent and available usage budget.
Portfolio-service prompts are contextual conversation entry points, not licensed professional services, automated account management or brokerage execution.
Investment depth
More context than a price chart alone.
Look up a stock or fund and review its available price history, fundamentals, dividend information and portfolio position in one research view.
Coverage varies by investment and source. Not every fundamental, complete fund holding, analyst estimate or live news item is available for every ticker. Buy/Sell controls record portfolio transactions; they do not execute brokerage trades.
More captured detail & methodology
Lookup is not limited to investments you already hold. Inspect reported results separately from estimates. A calculated score is not a buy signal. Missing values are unavailable—not zero.
Compare alternatives
Put investments side by side before deciding what to investigate.
Compare available yield, valuation, performance and other metrics across selected investments without piecing together separate quote pages.
SCHD and VOO are a demonstration, not endorsed recommendations. Missing values remain unavailable. Compare matching windows and units; yield is not total return. These captured examples are not live quotes.
More captured detail & methodology
Choose relevant metric columns, investigate similar-investment suggestions, and return to or share comparison symbols saved in the URL. Free offers limited comparison capacity; Pro expands it. Differences do not establish personal suitability.
Discover ideas
Find an idea. Then investigate it.
Explore discovery tools and screen covered investments using criteria that matter to your research, rather than starting with a blank ticker box.
The screener covers a defined universe, not every traded security. Rankings and filters are research aids—not suitability checks or guaranteed opportunities. Curated Hidden Gems are curated write-ups, not AI-generated recommendations.
More captured detail & methodology
Investment Finder uses goal/risk-oriented application criteria, not certified suitability advice. Find the Dip uses pullback-based market/technical scoring; a decline does not prove undervaluation.
Dividend Programs show supported dividend-increase groups; past increases do not guarantee future payments. Income Quality examines available distribution-quality evidence for supported high-yield/options-income funds, not proof of sustainability.
Test assumptions
Test the assumptions behind an investment idea.
Explore dividend reinvestment scenarios and, where enabled, historical strategy comparisons to understand how different assumptions change the result.
Calculators are deterministic scenarios, not AI forecasts or promised returns. Preserve the inputs, time horizon and reinvestment assumptions. Real-world taxes, fees, inflation, variable payments and fractional-share rounding can change outcomes.
Methodology & coverage
The Pro DRIP Calculator supports up to six symbol rows with separate starting amounts and rate assumptions, combined into an overall projection. Monthly contributions, price/dividend growth and horizon affect the result.
The Pro Portfolio Backtester examines hypothetical historical allocations and benchmark comparisons. Its dividend-reinvestment total-return option defaults on; check the selected mode and actual date window. Historical results are not forecasts. Coverage, methodology and real-world costs limit any scenario. No backtest result is invented for this page.
Research, with clear limits.
Can I research an investment before adding it to my portfolio?
Yes. Investment lookup and research are not limited to securities you already hold. Some advanced features require eligible Pro or trial access.
Can I compare more than one stock or fund?
Yes. Free includes limited comparisons; Pro expands comparison capacity. Available metrics depend on supported data coverage.
Does a higher dividend yield mean a better investment?
No. Yield is one input. Review available payout coverage, dividend history, growth, income concentration and fund-specific distribution information.
Are the DRIP Calculator and Backtester predictions?
No. The calculator models assumptions; the backtester examines a hypothetical historical allocation. Neither guarantees future performance or models every real-world cost.
How does AI fit into Research?
Hootie can help explain available investment and portfolio context. Research also includes calculated metrics and rule-based tools that are not generative AI. Verify important facts, sources and dates.
Your investments. Clearer explanations.
AI explanations alongside portfolio analytics. See what to ask—and what to investigate next.
Understand your portfolio—not just the market.
What should I investigate in my portfolio first?
Illustrative app context
Portfolio review context
- Largest positions
- Combined holdings
- Sector exposure
- Allocation context
- Recent performance
- Review the period
- Upcoming events
- Check available dates
Read the calculated overview. Ask Hootie what to investigate.
Illustrative explanation
A useful review starts with your largest positions, sector exposure, recent performance, and upcoming events. A portfolio can hold many investments and still depend heavily on a small number of companies or sectors.
Follow-up to ask in the app
Show me my largest positions and sector exposure.
Know the limits. Ask Hootie uses available portfolio context; the daily portfolio brief lives in Research → Insights. Not every Dashboard card contains an AI narrative.
Ask what your combined accounts might hide.
Am I more concentrated than I realize across my accounts?
Illustrative app context
Company A · fictional figures
- Account A
- $20,000
- Account B
- $10,000
- Combined portfolio
- $150,000
- Direct company weight
- 20%
- Additional fund exposure
- Unknown · excluded
($20,000 + $10,000) ÷ $150,000 = 20%. Two accounts, one company.
Illustrative explanation
Holding the same company in more than one account can increase its combined weight. Funds may also hold companies you own directly. Review direct positions and available fund look-through coverage together; incomplete fund data should not be treated as zero exposure.
Follow-up to ask in the app
Explain the concentration risks shown in my risk analysis.
Know the limits. Aggregation, risk statistics and stress scenarios are calculations, not generative AI. Fund look-through is best-effort and coverage-dependent; fund exposure is excluded here.
Look beyond the highest yield.
Which of my dividend holdings deserve a closer look, and why?
Illustrative app context
Income run-rate · fictional figures
- Holding A · estimated annual
- $12,000
- Total · estimated annual
- $20,000
- Holding A share
- 60%
- Hypothetical A reduction
- 50%
- Total run-rate reduction
- 30%
A $6,000 reduction takes $20,000 to $14,000: 30% less total income.
Illustrative explanation
Yield alone does not establish dividend quality. Review available payout coverage, dividend growth, payment history, and how much of your income depends on each holding. Missing information should remain unknown—not become a reassuring score.
Follow-up to ask in the app
Which holdings contribute most to my dividend income?
Know the limits. Income totals and dividend-quality scores are deterministic calculations—not AI predictions or payment guarantees. This hypothetical reduction is scenario arithmetic, not a predicted cut; all other income stays unchanged.
Get a focused overview before digging deeper.
What should I review about this investment before making a decision?
Illustrative app context
Hootie Insights · evidence checklist
- Company & quote
- Check source and date
- Earnings
- Reported vs. estimated
- Upcoming events
- Retain estimated labels
- SEC filing notices
- Dated notices only
- Missing evidence
- Unavailable · not inferred
No company findings, source notices or event dates are invented in this illustration.
Illustrative explanation
An investment brief brings together available company and quote information, reported earnings, dividend schedules, and dated SEC filing notices. Review the source links, upcoming events, and any missing information before drawing conclusions.
Follow-up to ask in the app
Which information is reported, which is estimated, and what is unavailable?
Know the limits. Hootie Insights beside a Research ticker creates an on-demand brief. Evidence may include up to five official SEC filing notices from the preceding 90 days—not full-filing analysis or comprehensive live news.
Understand the earnings story behind the headline.
Did earnings and revenue tell the same story?
Illustrative app context
Earnings · comparison checklist
- EPS
- Actual vs. estimate
- Revenue
- Actual vs. estimate
- Prior quarters
- Where available
- Cause of a difference
- Requires evidence
A possible pattern, not a reported company result. No earnings figures supplied.
Illustrative explanation
An EPS beat and a revenue miss can occur in the same quarter. Compare reported results with available estimates and prior quarters, then investigate whether margins, costs, or another disclosed factor explains the difference. The numbers alone do not prove the cause.
Follow-up to ask in the app
Compare the available reported quarters and explain the differences.
Know the limits. AI summarizes supplied EPS/revenue history; Hootie supports earnings follow-ups. No management commentary, cause or future report date is inferred, and no dedicated two-quarter comparison screen is implied.
Keep the important context in view.
What deserves attention in my weekly portfolio review?
Illustrative app context
Illustrative report excerpt
- Portfolio changes
- Review holdings & movers
- Income
- Check dependencies
- Upcoming events
- Verify available dates
Topic outline only—not an actual report or an account finding.
Open SavvyStocksIllustrative explanation
Start with portfolio changes, major movers, income, and upcoming events. A concentrated sector, an income dependency, or an approaching earnings date can be a reason to investigate—not an instruction to trade.
Follow-up to ask in the app
Open the app to investigate the supporting portfolio details.
Know the limits. Opted-in portfolio email reports can include AI educational insights. Eligibility, service availability and usage controls apply; delivery is not guaranteed and not all notifications use AI.
Editorial illustrations—not captured AI answers or live results. Worked figures are fictional; selecting an example makes no AI or market-data request.
Where AI appears
- Ask Hootie
- Portfolio-aware conversation
- Research
- Daily brief, ticker insights & earnings
- Opted-in reports
- Educational portfolio insights
No credit card required. AI requires Pro, consent and available usage budget; coverage and availability vary.
Context, not certainty. Analytics and scores are calculated, not generative. AI can be inaccurate; verify sources, dates and estimates. No personalized investment, legal or tax advice. No automatic trades.
Know what changed. Keep your focus.
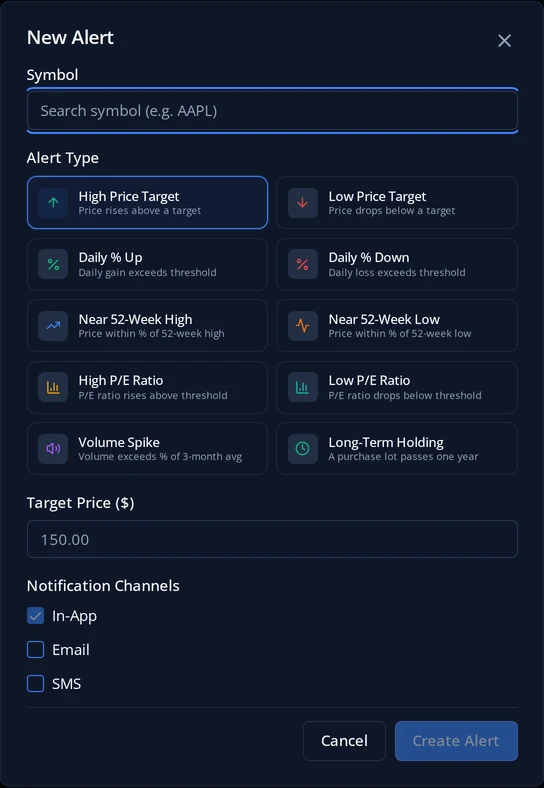
Set useful reminders around the holdings you follow.
- Follow selected price and market thresholds.
- Review dividend and earnings notices.
- Use U.S. taxable-lot holding reminders; verify broker and tax treatment.
Bring your accounts. Choose your way in.
Start with a file or connect a supported brokerage. Import and connection setup happen in the app.
Free: CSV/Excel import, supported connections and scheduled sync within one portfolio and 12 active non-cash holdings. Pro: on-demand sync where supported. Coverage and sync availability depend on your provider. Multiple accounts alone are not Pro-only. Compare plans
Manual CSV or Excel import
Bring a holdings file into the app, check the supported format and review what you import.
Supported brokerage sync
Set up a supported connection in Account. Scheduled updates and available data vary by brokerage and provider.
This preview does not accept files or connect accounts.
Watch: connect a brokerage or import holdings
Supported connections and CSV/Excel import are Free within plan limits. Scheduled sync is available on Free; on-demand sync is Pro. Connection coverage varies.